
Numbers people
read at a glance.
We design investor decks, annual reports and data-heavy presentations that are clear on first look. Charts stay editable, figures stay updatable.
● WHO IS LISTENING
The person across the table.
A deck that gets updated every quarter and still looks consistent.
An investor deck that tells the revenue projection and growth story clearly.
An A4 report format that prints well and travels well as a PDF.
● ANATOMY OF THE DECK
The order it is told in.
-
Three numbers and one message for the person who decides.
-
Revenue, costs and margins in clean, aligned tables.
-
Scenarios and ranges shown as fan charts, honest rather than decorative.
-
Every tracked metric on one page, period over period.
-
Market size, positioning and roadmap.
-
Methodology, sources and disclaimers, organised and easy to find.
● IN-HOUSE COST
How many people build this deck on your team?
With example values: 36 hours per person, 4 people with 8 hours each of meetings and sign-off, €45 per hour.
● HOW WE BUILD IT
Readable at a glance
Every slide has one lead number and everything else supports it. We use colour and hierarchy to set reading order, not to decorate.
Charts stay live
We build charts as native PowerPoint objects, never as images. The data stays linked to Excel, so when your team changes a figure, the chart follows.
A4 portrait and print
Report decks are designed in A4 portrait so they work on screen and on paper. Margins, type sizes and colour profiles are set for that from day one.
Confidential by default
Financial data is sensitive until it is published. We can start under NDA, and only the people on the project see the files.
DELIVERY
● REAL WORK
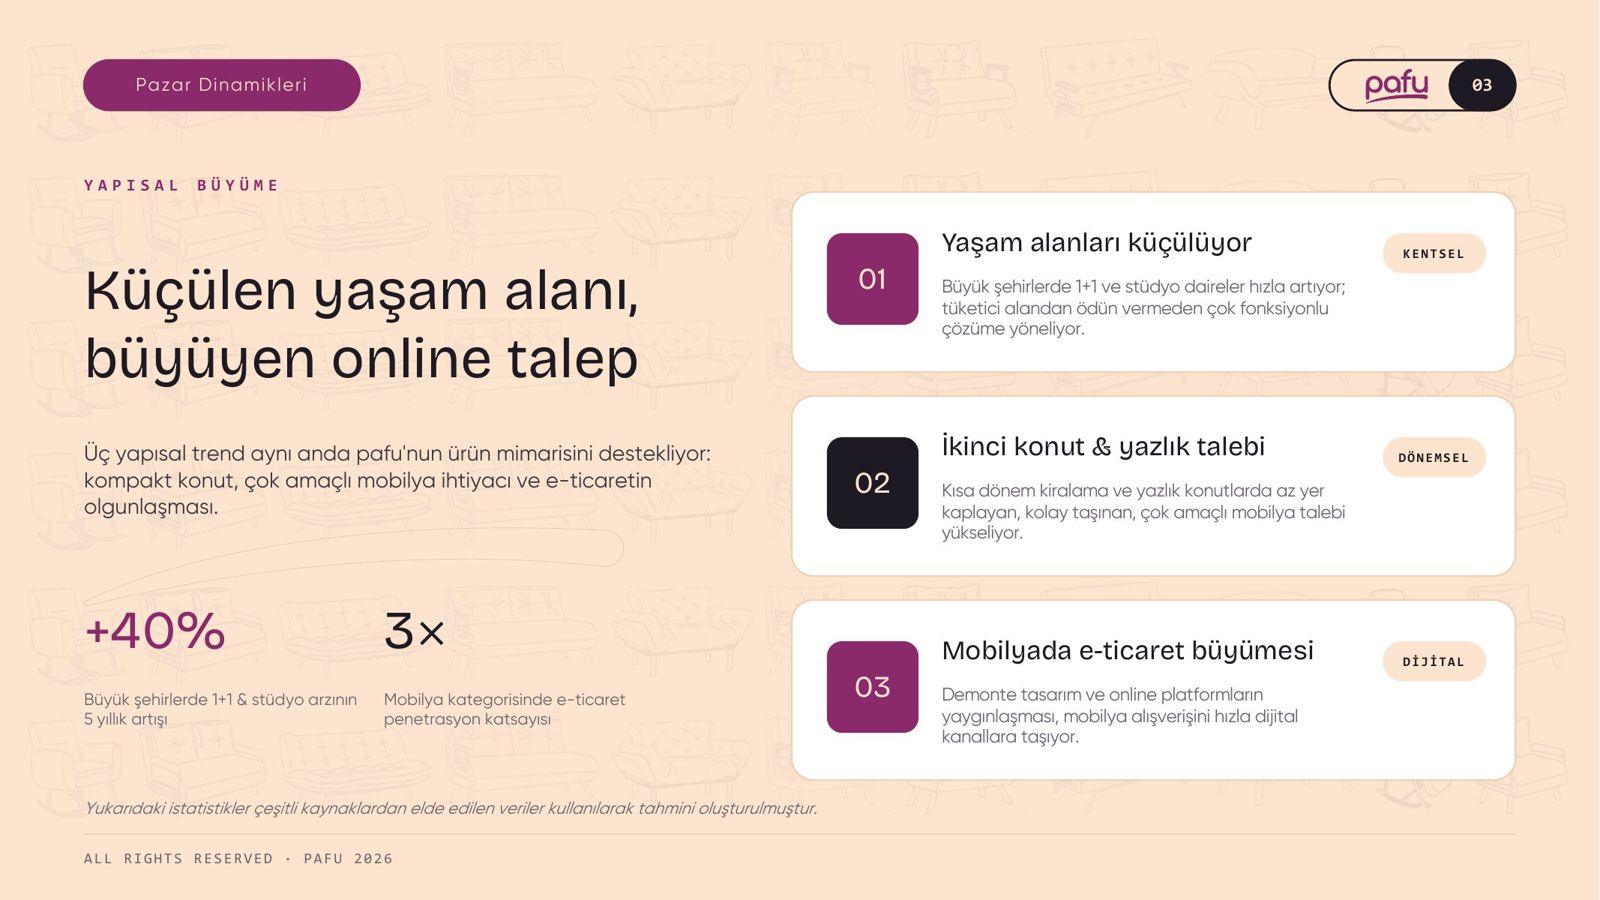
We produced presentation work for Borsa İstanbul and designed an investor deck for PAFU with revenue projections shown as fan charts.
How long does a financial presentation take?
It depends on scope, how ready the data is and your approval rounds. After the brief we set a clear schedule: draft design, design, delivery.
Can we update the charts ourselves later?
Yes. Charts are native PowerPoint objects linked to Excel data. Change the number and the layout holds.
Do you handle quarterly updates?
We do. Once the structure is built, later periods only need new data and copy. Your team can do it, or we can.
How do you handle confidential data?
We can sign an NDA before the project starts. Only the project team has access to the files, and nothing is shared before publication.
Can the deck be produced in several languages?
We work in English, German and Turkish. All language versions run on the same template, so the layout holds even when text lengths change.
Will it work in Google Slides?
You can import the file, but Excel-linked charts and some fonts behave differently there. If your team works in Google Slides, tell us in the brief and we will plan the build around it.